.png)
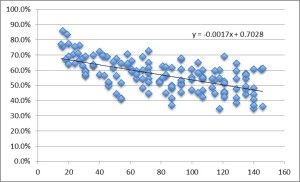
We compiled a list of every ABA Accredited law school, along with their latest US News & World Report ranking and their Law School Transparency employment score. To determine which law schools are the most underrated relative to the above, we plotted this data (see below) and came up with a linear trend line, then measured each data point’s vertical distance from the trend line. This distance is also called the “Residual,” which you can see below for each law school. Positive residuals indicate that the school in question has a higher employment score relative to its ranking. The higher the positive number, the greater the discrepancy between ranking and employment score. Negative residuals indicate that the school has a lower employment score relative to its ranking. Some things to note: Unranked schools were listed as “150″ — below any ranked school — but this should not be taken to mean that these schools are necessarily cognates. Law School Transparency employment scores include all full-time, long-term, bar passage required jobs, excluding solo practitioners.This does include school-funded employment. To read more about what goes into the Law School Transparency employment score, visit their website to view the methodology.
| LAW SCHOOL | RANKING | EMP. SCORE | RESIDUAL | |
|---|---|---|---|---|
| Akron | 121 | 45.8% | 0.4673 | -0.009 |
| Alabama | 23 | 70.5% | 0.7221 | -0.017 |
| Albany | 118 | 60.2% | 0.4751 | 0.127 |
| American | 72 | 44.6% | 0.5947 | -0.149 |
| Appalachian | 150 | 42.0% | 0.3919 | 0.028 |
| Arizona State | 31 | 59.8% | 0.7013 | -0.103 |
| Arizona Summit | 150 | 40.5% | 0.3919 | 0.013 |
| Arizona, University of | 40 | 57.1% | 0.6779 | -0.107 |
| Arkansas, Fayetteville | 61 | 65.9% | 0.6233 | 0.036 |
| Arkansas, Little Rock | 121 | 44.8% | 0.4673 | -0.019 |
| Atlanta’s John Marshall | 150 | 32.5% | 0.3919 | -0.067 |
| Ave Maria | 150 | 30.2% | 0.3919 | -0.090 |
| Baltimore, University of | 135 | 44.1% | 0.4309 | 0.010 |
| Barry University | 150 | 32.8% | 0.3919 | -0.064 |
| Baylor | 51 | 67.6% | 0.6493 | 0.027 |
| Boston College | 36 | 63.6% | 0.6883 | -0.052 |
| Boston University | 27 | 66.9% | 0.7117 | -0.043 |
| Brigham Young U | 36 | 63.3% | 0.6883 | -0.055 |
| Brooklyn | 83 | 56.5% | 0.5661 | -0.001 |
| California Western | 150 | 31.3% | 0.3919 | -0.079 |
| California Berkeley | 9 | 86.7% | 0.7585 | 0.109 |
| California Davis | 36 | 69.9% | 0.6883 | 0.011 |
| California Hastings | 54 | 41.6% | 0.6415 | -0.226 |
| California Los Angeles | 16 | 75.6% | 0.7403 | 0.016 |
| Campbell | 121 | 52.6% | 0.4673 | 0.059 |
| Capital | 150 | 38.4% | 0.3919 | -0.008 |
| Cardozo | 64 | 54.3% | 0.6155 | -0.073 |
| Case Western | 64 | 58.6% | 0.6155 | -0.030 |
| Catholic | 107 | 46.6% | 0.5037 | -0.038 |
| Chapman | 140 | 34.9% | 0.4179 | -0.069 |
| Charleston | 150 | 51.6% | 0.3919 | 0.124 |
| Charlotte | 150 | 30.3% | 0.3919 | -0.089 |
| Chicago, University of | 4 | 92.1% | 0.7715 | 0.150 |
| Chicago-Kent | 72 | 54.3% | 0.5947 | -0.052 |
| Cincinnati | 79 | 53.0% | 0.5765 | -0.047 |
| CUNY | 113 | 48.6% | 0.4881 | -0.002 |
| Cleveland State | 115 | 44.7% | 0.4829 | -0.036 |
| Colorado, University of | 43 | 69.3% | 0.6701 | 0.023 |
| Columbia | 4 | 95.0% | 0.7715 | 0.179 |
| Connecticut, University of | 54 | 41.2% | 0.6415 | -0.230 |
| Cornell | 13 | 88.6% | 0.7481 | 0.138 |
| Creighton | 115 | 53.6% | 0.4829 | 0.053 |
| Dayton, University of | 150 | 57.5% | 0.3919 | 0.183 |
| Denver, University of | 68 | 54.1% | 0.6051 | -0.064 |
| DePaul | 121 | 45.4% | 0.4673 | -0.013 |
| Detroit Mercy | 150 | 31.8% | 0.3919 | -0.074 |
| Drake | 113 | 54.3% | 0.4881 | 0.055 |
| Drexel | 129 | 47.8% | 0.4465 | 0.031 |
| Duke | 10 | 85.9% | 0.7559 | 0.103 |
| Duquesne | 121 | 51.2% | 0.4673 | 0.045 |
| Elon | 150 | 32.0% | 0.3919 | -0.072 |
| Emory | 19 | 83.6% | 0.7325 | 0.104 |
| Faulkner | 150 | 48.5% | 0.3919 | 0.093 |
| Florida A&M | 150 | 34.8% | 0.3919 | -0.044 |
| Florida Coastal | 150 | 29.5% | 0.3919 | -0.097 |
| Florida International | 100 | 55.4% | 0.5219 | 0.032 |
| Florida State | 45 | 68.8% | 0.6649 | 0.023 |
| Florida, University of | 49 | 65.5% | 0.6545 | 0.000 |
| Fordham | 36 | 63.4% | 0.6883 | -0.054 |
| George Mason | 46 | 49.4% | 0.6623 | -0.168 |
| George Washington | 20 | 77.4% | 0.7299 | 0.044 |
| Georgetown | 13 | 83.7% | 0.7481 | 0.089 |
| Georgia State | 64 | 59.5% | 0.6155 | -0.021 |
| Georgia, University of | 29 | 67.9% | 0.7065 | -0.028 |
| Golden Gate | 150 | 22.4% | 0.3919 | -0.168 |
| Gonzaga | 107 | 60.2% | 0.5037 | 0.098 |
| Hamline University | 121 | 42.2% | 0.4673 | -0.045 |
| Harvard University | 2 | 86.9% | 0.7767 | 0.092 |
| Hawaii, University of | 100 | 53.8% | 0.5219 | 0.016 |
| Hofstra University | 135 | 47.3% | 0.4309 | 0.042 |
| Houston, University of | 58 | 63.2% | 0.6311 | 0.001 |
| Howard University | 135 | 49.3% | 0.4309 | 0.062 |
| Idaho, University of | 118 | 54.6% | 0.4751 | 0.071 |
| Illinois, University of | 40 | 72.3% | 0.6779 | 0.045 |
| Indiana — Bloomington | 29 | 62.8% | 0.7065 | -0.079 |
| Indiana — Indianapolis | 87 | 47.9% | 0.5557 | -0.077 |
| Inter American (PR) | 150 | 22.0% | 0.3919 | -0.172 |
| Iowa, University of | 27 | 76.3% | 0.7117 | 0.051 |
| John Marshall Law School | 150 | 48.9% | 0.3919 | 0.097 |
| Kansas, University of | 68 | 60.1% | 0.6051 | -0.004 |
| Kentucky, University of | 58 | 70.7% | 0.6311 | 0.076 |
| Lewis & Clark | 72 | 52.0% | 0.5947 | -0.075 |
| Liberty University | 150 | 29.0% | 0.3919 | -0.102 |
| Louisiana State University | 72 | 65.1% | 0.5947 | 0.056 |
| Louisville, University of | 87 | 61.7% | 0.5557 | 0.061 |
| Loyola Marymount | 87 | 50.1% | 0.5557 | -0.055 |
| Loyola — Chicago | 68 | 48.3% | 0.6051 | -0.122 |
| Loyola — New Orleans | 150 | 48.8% | 0.3919 | 0.096 |
| Maine, University of | 129 | 38.5% | 0.4465 | -0.062 |
| Marquette University | 93 | 51.5% | 0.5401 | -0.025 |
| Maryland, University of | 46 | 51.9% | 0.6623 | -0.143 |
| McGeorge | 146 | 36.2% | 0.4023 | -0.040 |
| Memphis, University of | 140 | 60.5% | 0.4179 | 0.187 |
| Mercer University | 104 | 65.0% | 0.5115 | 0.139 |
| Miami, University of | 61 | 60.5% | 0.6233 | -0.018 |
| Michigan State University | 87 | 36.9% | 0.5557 | -0.187 |
| Michigan, University of | 10 | 82.0% | 0.7559 | 0.064 |
| Minnesota, University of | 20 | 69.0% | 0.7299 | -0.040 |
| Mississippi College | 150 | 51.9% | 0.3919 | 0.127 |
| Mississippi, University of | 104 | 58.4% | 0.5115 | 0.072 |
| Missouri, University of | 64 | 57.3% | 0.6155 | -0.043 |
| Missouri — Kansas City, University of | 104 | 45.1% | 0.5115 | -0.061 |
| Montana, University of | 121 | 69.1% | 0.4673 | 0.224 |
| Nebraska, University of | 54 | 64.5% | 0.6415 | 0.003 |
| New England Law | 140 | 36.8% | 0.4179 | -0.050 |
| New Hampshire, University of | 93 | 67.3% | 0.5401 | 0.133 |
| New Mexico, University of | 72 | 72.8% | 0.5947 | 0.133 |
| New York Law School | 140 | 44.0% | 0.4179 | 0.022 |
| New York University | 6 | 93.7% | 0.7663 | 0.171 |
| North Carolina Central University | 150 | 14.8% | 0.3919 | -0.244 |
| North Carolina, University of | 31 | 69.0% | 0.7013 | -0.011 |
| North Dakota, University of | 129 | 59.5% | 0.4465 | 0.149 |
| Northeastern University | 93 | 45.4% | 0.5401 | -0.086 |
| Northern Illinois University | 150 | 50.4% | 0.3919 | 0.112 |
| Northern Kentucky University | 150 | 37.5% | 0.3919 | -0.017 |
| Northwestern University | 12 | 79.2% | 0.7507 | 0.041 |
| Notre Dame, University of | 26 | 71.2% | 0.7143 | -0.002 |
| Nova Southeastern University | 150 | 58.6% | 0.3919 | 0.194 |
| Ohio Northern University | 150 | 59.4% | 0.3919 | 0.202 |
| Ohio State University | 31 | 59.1% | 0.7013 | -0.110 |
| Oklahoma City University | 150 | 56.5% | 0.3919 | 0.173 |
| Oklahoma, University of | 58 | 64.1% | 0.6311 | 0.010 |
| Oregon, University of | 100 | 47.0% | 0.5219 | -0.052 |
| Pace University | 140 | 40.8% | 0.4179 | -0.010 |
| Pennsylvania State University | 51 | 44.5% | 0.6493 | -0.204 |
| Pennsylvania, University of | 7 | 90.7% | 0.7637 | 0.143 |
| Pepperdine University | 54 | 51.6% | 0.6415 | -0.126 |
| Pittsburgh, University of | 81 | 55.0% | 0.5713 | -0.021 |
| Pontifical Catholic (PR) | 150 | 4.2% | 0.3919 | -0.350 |
| Puerto Rico, University of | 150 | 18.3% | 0.3919 | -0.209 |
| Quinnipiac University | 118 | 34.5% | 0.4751 | -0.130 |
| Regent University | 150 | 55.1% | 0.3919 | 0.159 |
| Richmond, University of | 51 | 56.3% | 0.6493 | -0.086 |
| Roger Williams University | 150 | 40.6% | 0.3919 | 0.014 |
| Rutgers University — Camden | 81 | 62.7% | 0.5713 | 0.056 |
| Rutgers University — Newark | 83 | 44.9% | 0.5661 | -0.117 |
| Saint Louis University | 93 | 50.5% | 0.5401 | -0.035 |
| Samford University | 135 | 57.8% | 0.4309 | 0.147 |
| San Diego, University of | 79 | 51.9% | 0.5765 | -0.058 |
| San Francisco, University of | 150 | 34.0% | 0.3919 | -0.052 |
| Santa Clara University | 107 | 42.2% | 0.5037 | -0.082 |
| Seattle University | 87 | 41.5% | 0.5557 | -0.141 |
| Seton Hall University | 68 | 68.9% | 0.6051 | 0.084 |
| South Carolina, University of | 93 | 67.7% | 0.5401 | 0.137 |
| South Dakota, University of | 145 | 60.6% | 0.4049 | 0.201 |
| South Texas College of Law | 146 | 61.2% | 0.4023 | 0.210 |
| Southern California, University of | 20 | 63.9% | 0.7299 | -0.091 |
| Southern Illinois University | 150 | 70.5% | 0.3919 | 0.313 |
| Southern Methodist University | 42 | 69.6% | 0.6727 | 0.023 |
| Southern University | 150 | 22.8% | 0.3919 | -0.164 |
| Southwestern Law School | 150 | 38.3% | 0.3919 | -0.009 |
| St. John’s University | 107 | 55.7% | 0.5037 | 0.053 |
| St. Mary’s University | 150 | 52.8% | 0.3919 | 0.136 |
| St. Thomas University (Florida) | 150 | 43.9% | 0.3919 | 0.047 |
| St. Thomas, University of (Minnesota) | 129 | 41.8% | 0.4465 | -0.029 |
| Stanford University | 3 | 87.6% | 0.7741 | 0.102 |
| Stetson University | 93 | 60.7% | 0.5401 | 0.067 |
| Suffolk University | 150 | 35.7% | 0.3919 | -0.035 |
| Syracuse University | 107 | 54.4% | 0.5037 | 0.040 |
| Temple University | 61 | 59.0% | 0.6233 | -0.033 |
| Tennessee, University of | 72 | 61.7% | 0.5947 | 0.022 |
| Texas A&M University | 150 | 38.1% | 0.3919 | -0.011 |
| Texas at Austin, University of | 15 | 77.2% | 0.7429 | 0.029 |
| Texas Southern University | 150 | 34.0% | 0.3919 | -0.052 |
| Texas Tech University | 107 | 55.0% | 0.5037 | 0.046 |
| Thomas Jefferson School of Law | 150 | 25.9% | 0.3919 | -0.133 |
| Thomas M. Cooley Law School | 150 | 22.9% | 0.3919 | -0.163 |
| Toledo, University of | 140 | 48.3% | 0.4179 | 0.065 |
| Touro College | 150 | 51.7% | 0.3919 | 0.125 |
| Tulane University | 46 | 52.0% | 0.6623 | -0.142 |
| Tulsa, University of | 72 | 58.0% | 0.5947 | -0.015 |
| University of Buffalo — SUNY | 100 | 60.5% | 0.5219 | 0.083 |
| University of La Verne | 150 | 29.1% | 0.3919 | -0.101 |
| University of Massachusetts Dartmouth | 150 | 23.3% | 0.3919 | -0.159 |
| University of Nevada Las Vegas | 83 | 62.1% | 0.5661 | 0.055 |
| University of the District of Columbia | 150 | 23.8% | 0.3919 | -0.154 |
| Utah, University of | 49 | 61.4% | 0.6545 | -0.041 |
| Valparaiso University | 150 | 38.4% | 0.3919 | -0.008 |
| Vanderbilt University | 16 | 85.9% | 0.7403 | 0.119 |
| Vermont Law School | 129 | 54.5% | 0.4465 | 0.099 |
| Villanova University | 93 | 53.3% | 0.5401 | -0.007 |
| Virginia, University of | 8 | 95.6% | 0.7611 | 0.195 |
| Wake Forest University | 31 | 56.6% | 0.7013 | -0.135 |
| Washburn University | 115 | 59.6% | 0.4829 | 0.113 |
| Washington and Lee University | 43 | 56.6% | 0.6701 | -0.104 |
| Washington University | 18 | 67.0% | 0.7351 | -0.065 |
| Washington, University of | 24 | 64.5% | 0.7195 | -0.075 |
| Wayne State University | 87 | 48.9% | 0.5557 | -0.067 |
| West Virginia University | 83 | 56.9% | 0.5661 | 0.003 |
| Western New England University | 150 | 33.1% | 0.3919 | -0.061 |
| Western State College of Law | 150 | 33.3% | 0.3919 | -0.059 |
| Whittier Law School | 150 | 26.2% | 0.3919 | -0.130 |
| Widener University | 150 | 48.0% | 0.3919 | 0.088 |
| Willamette University | 135 | 54.5% | 0.4309 | 0.114 |
| William and Mary Law School | 24 | 75.6% | 0.7195 | 0.037 |
| William Mitchell College of Law | 135 | 56.9% | 0.4309 | 0.138 |
| Wisconsin, University of | 31 | 57.1% | 0.7013 | -0.130 |
| Wyoming, University of | 129 | 64.5% | 0.4465 | 0.199 |
| Yale University | 1 | 78.8% | 0.7793 | 0.009 |


